SERVICES
Helping you turn data into clear, actionable insights.
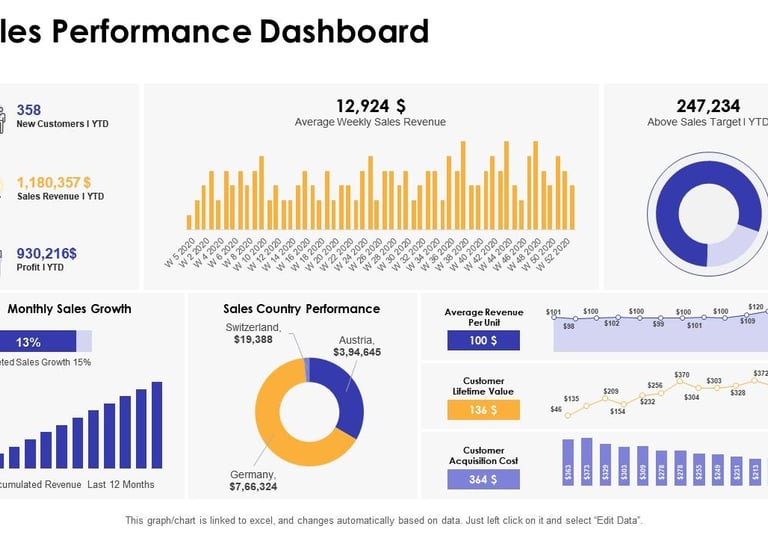
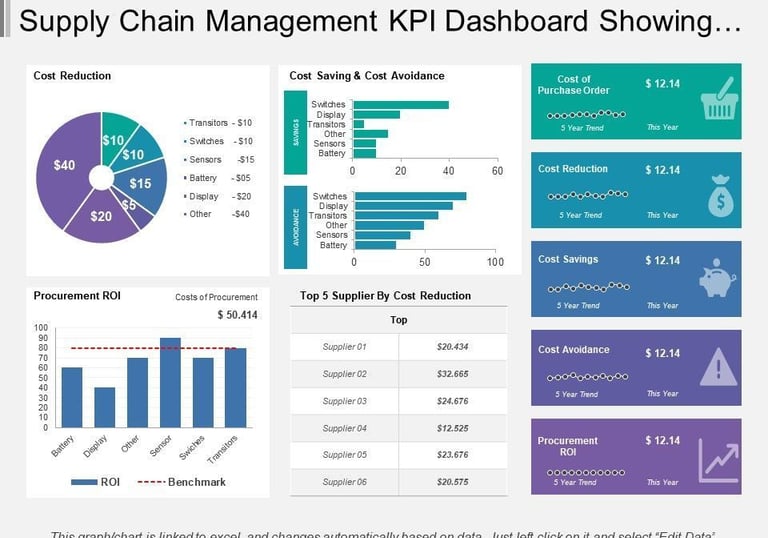
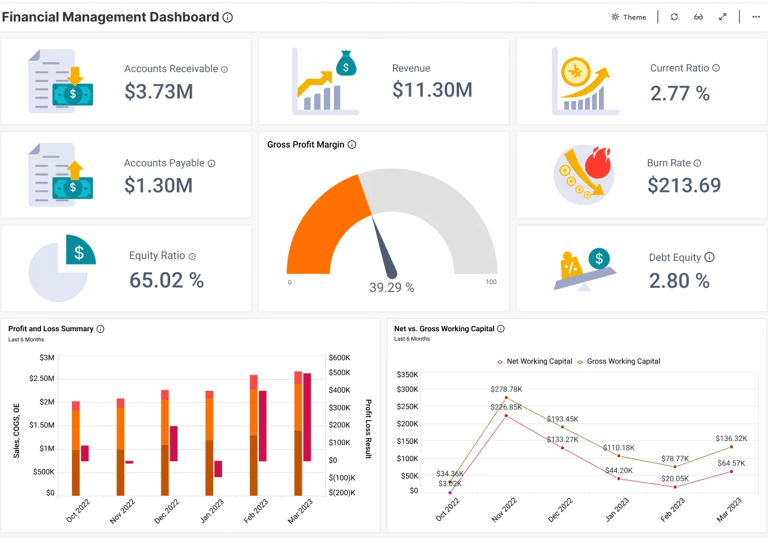
Custom KPI Dashboards & Automated Reporting
Transform raw data into real-time, decision-ready dashboards.

Predictive Analytics & Machine Learning Models
Go beyond “what happened” and understand what will happen next.
Remove manual work. Increase accuracy. Speed up decision-making.
Data Automation & AI-Powered Process Optimisation
What we deliver:
Power BI / Tableau dashboards
Automated daily/weekly/monthly reporting
Sales, marketing, finance & operations dashboards
Region-wise, product-wise, rep-wise performance tracking
Customer lifetime value, conversion funnel & CAC insights
Why it matters:
Businesses get instant visibility into performance without wasting hours on Excel.
What we deliver:
Sales forecasting models
Churn prediction (which customers may stop buying)
High-value customer prediction models
Lead scoring models
Demand forecasting for inventory/business planning
Why it matters:
Companies can make proactive decisions, allocate budgets better, and increase revenue predictably.
What we deliver:
Automated data pipelines
Lead distribution automation
Follow-up + CRM activity automation
Auto-generated performance reports
Data cleaning & standardization systems
AI-powered insights & recommendations
Why it matters:
Businesses save 20–40 hours/month and eliminate human error.
Client: Automation Manufacturing Company, USA
Service: KPI Dashboards + Data Automation
Challenge
The company managed sales and production data manually in Excel across multiple branches.
This caused:
Delayed reporting (3–4 days)
No visibility on region-wise sales
Difficulty forecasting monthly demand
High dependency on teams for updates
Our Solution
Analytic HUB built a real-time Power BI dashboard that tracked:
Daily sales performance
Region-wise demand
Product category profitability
Inventory movement
Sales rep effectiveness
Monthly forecasting model
We also automated daily reports through scheduled data pipelines.
Impact
100% elimination of manual reports
Sales team response time improved by 42%
Accurate demand forecasting reduced stockouts
Leadership received real-time insights for decision-making
Key Metrics
Reporting time reduced: 4 days → 5 seconds
Forecast accuracy: Improved by 27%
Sales productivity increased: +19
Client: Jewellery Export House, India
Service: Sales Analytics + Predictive Modelling
Challenge
The client struggled with:
Tracking global customer trends
Identifying high-value buyers
Measuring rep performance
Understanding product-wise profitability
Their data was spread across WhatsApp, Excel, email, and CRM.
Our Solution
Analytic HUB created a single integrated dashboard connecting:
Sales logs
Product data
Customer profiles
Rep-wise performance
Country-wise demand trends
We also implemented:
High-Value Customer Prediction Model
Rep Performance Score Algorithm
Impact
Clear visibility into top-performing markets
Optimized follow-ups improved conversions
Better product planning for US + Middle East clients
Key Metrics
Conversion rate increased: 18%
High-value customer identification accuracy: 81%
Follow-up efficiency improved by: 36%
Client: Real Estate Lead Generation Agency, Florida
Service: Marketing Analytics + Lead Automation
Challenge
The agency was spending heavily on Meta & Google Ads but couldn't track:
Cost per qualified lead
Lead quality by campaign
Agent follow-up performance
Funnel drop-offs
ROI per region
Our Solution
Analytic HUB implemented:
Marketing ROI Dashboard
Lead Quality Scoring Model
Automated Lead Distribution System
Daily ad performance report to WhatsApp/Email
Impact
Smarter ad budget allocation
Better collaboration between marketing and sales
Lead leakage has been reduced significantly
Faster decision-making with daily automated insights
Key Metrics
Cost per qualified lead reduced: 24%
Lead-to-appointment conversion improved: 32%
Manual work reduced: 20+ hours/month
FAQ
Q1. What does Analytic HUB do?
Analytic HUB turns your business data into clear insights, predictive models, and automated dashboards so you can make smarter decisions faster.
Q2. Who is your service ideal for?
We work best with SMBs, mid-sized companies, and growing businesses that want better reporting, forecasting, automation, and data clarity.
Q3. How long does it take to build a dashboard?
Most dashboards are delivered within 7–10 working days, depending on data availability.
Q4. What tools do you use?
We primarily use Power BI, Tableau, Python, SQL, Excel Automation, Google Analytics, and AI/ML frameworks.
Q5. Do you offer predictive analytics and AI models?
Yes. We build forecasting, churn prediction, lead scoring, customer value prediction, inventory planning, and other machine-learning models.
Q6. Can you automate our daily/weekly reports?
Yes. We automate reporting so you no longer need to manually prepare Excel or PDF reports.
Q7. Do I need technical skills to use the dashboards?
No. Our dashboards are designed for non-technical users—simple, visual, and business-friendly.
Q8. How do your monthly plans work?
Choose from Starter, Growth, or Professional plans. All include deliverables, ongoing updates, a dedicated analyst, and monthly strategy calls.
Q9. What data do you need from us?
Sales, marketing, customer, product, region-wise, and operations data. Even if your data is messy, we help structure it.
Q10. Is my data secure?
Yes. Your data is stored securely with restricted access. NDAs are provided upon request.
Q11. Can you integrate with our CRM or ERP?
Yes. We integrate with HubSpot, Zoho, Salesforce, Tally, Shopify, Excel, Google Sheets, and most custom CRMs.
Q12. What if our data is unorganized?
No problem—we clean, structure, and prepare your data so dashboards run smoothly.
Q13. Do you provide ongoing support?
Yes. All plans include continuous support, optimization, and monthly review calls.
Q14. How do we get started?
Click on Contact Us to book a free consultation. We’ll review your needs and begin onboarding.